Monitor replication
Monitor status of data replication
This section covers the monitoring of replications through Replication Manager logs, scripted monitoring tools, exception logs, and monitoring plans with your browser.
Section | Description |
|---|---|
Replication Manager provides centralized logging of all replication activity. | |
FairCom Replication Manager provides a centralized view of specific replication plan status. | |
| |
Replication has no absolute dependency that source and target servers must have data completely in sync. In this case, data exceptions can occur. |
monitor replication status of data replication
Replication Manager provides centralized logging of all replication activity. Detailed views of all manager components can be filtered for advanced troubleshooting.

Filters
Filter | Description |
|---|---|
Server | Events are logged by a specific FairCom server. |
Repl.Studio | Events are logged by the Replication Manager. |
Agent | Events are logged by Replication Agent. |
Web Server | Events are logged by embedded HTTP daemon. |
Detail level
Detail level | Description |
|---|---|
1 | Only shows errors. |
2 | Shows basic information (limited). |
3 | Shows trace basic level details. |
4 | Shows trace detail level details. |
Severity level
Severity level | Description |
|---|---|
1 | Critical errors |
2 | Important errors |
3 | Normal errors |
4 | Shows informational messages. |
5 | Shows trace-level messages. |
Error code
The Error Code textbox can be used to search logs for a specific error code.
Function
The Function textbox can be used to search logs for specific functions. Partial matching is allowed but it is case-sensitive.
Dump data to file
The button will dump data for capture/analysis in the form of a .json file.
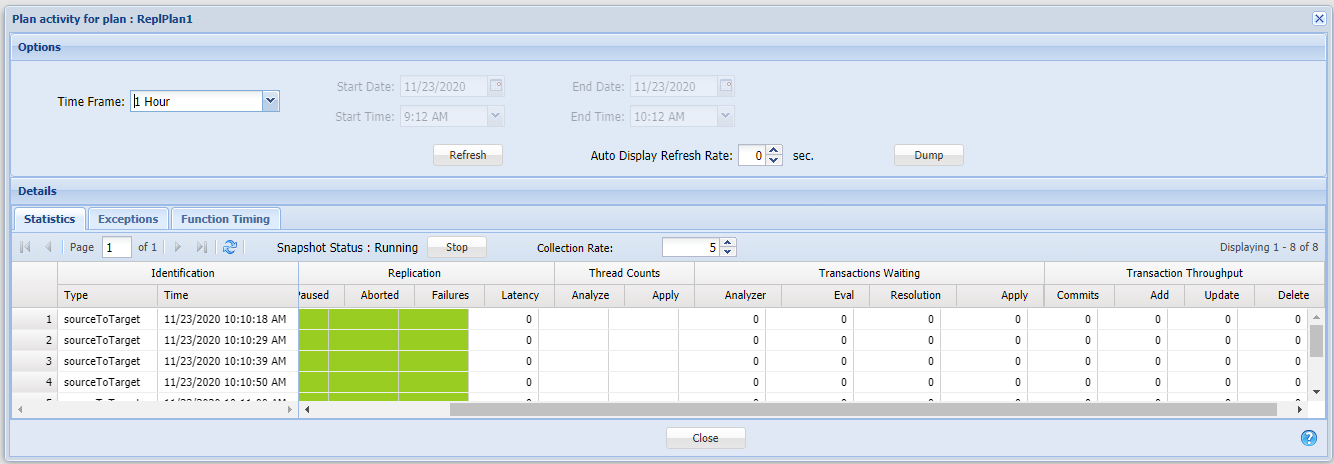
FairCom Replication Manager provides a centralized view of specific replication plan status.
Note
Use the Google Chrome browser for FairCom browser-based tools. Other browsers may cause unexpected behavior.

Quickly and visually view the current replication status with color-coded connection status
Search specific time ranges
Visually browse the exception log
Enable function timings for performance analysis
Dump data to file for capture and external analysis
    {
      "statID": 165,
      "direction": "direct",
      "time": "2020-11-23T22:38:47.000Z",
      "sourceDbName": "FAIRCOMS@Craig-Precision-5810",
      "targetDbName": "MEMPHIS@Craig-Precision-5810",
      "sourceDBEngine": true,
      "targetDBEngine": true,
      "main": {
        "sourceDbName": "FAIRCOMS@Craig-Precision-5810",
        "targetDbName": "MEMPHIS@Craig-Precision-5810"
      },
      "logShip": {
        "sourceTaskID": 34,
        "logNumber": 1,
        "logPosition": 2402789,
        "state": "source",
        "sequenceNumber": 682,
        "error": 0,
        "functionName": "ctReplReadLogData"
      },
      "logRead": {
        "sourceTaskID": 62,
        "targetTaskID": 63,
        "logNumber": 1,
        "logPosition": 2402387,
        "state": "source",
        "sequenceNumber": 1710,
        "error": 0,
        "functionName": "ctThrdQueueRead"
      },
      .....
      "transactionFailCounts": {
        "commit": 0,
        "add": 0,
        "delete": 0,
        "update": 0
      },
      "transactionProcessCounts": {
        "total": 0,
        "waitingOnAnalyze": 0,
        "waitingOnDependencyEval": 0,
        "waitingOnDependencyResolution": 0,
        "waitingOnApply": 0
      },
      "transactionSuccessCounts": {
        "commit": 1,
        "add": 1,
        "delete": 0,
        "update": 0
},repadm and ctrepd are included in your tools folder.
You can attach your agent process using your server credentials.
> repadm -u ADMIN -p ADMIN -s FAIRCOMS  -c getstate
c-treeACE(tm) Version 12.0.0.105(Build-201027) Replication Agent Management Utility
Copyright (C) 1992 - 2020 FairCom Corporation
ALL RIGHTS RESERVED.
s t   lognum     logpos   state    seqno time func
y y        1     235919  source     1652    0 ctReplGetNextChange
y y 1 235919 source 1652 0 ctReplGetNextChangeReplication has no absolute dependency that source and target servers must have data completely in sync. In this case, data exceptions can occur.
A table does not exist on the target resulting in error 12.
A record already exists on the target generating a duplicate key error 2 on add.
A record on the target was updated and no longer exactly matches the update applied from the source generating an 1105 error.
These types of errors don't halt replication from progressing. Instead, these events are logged in a table for later review and eventual resolution. This table is REPLLOGDT.FCS. This table should be reviewed on a regular schedule to ensure all exceptions are noted and understood.
Errors that impact the progression of replication such as connection issues are logged in ctreplagent.log and this should be reviewed when replication is not functioning as expected.
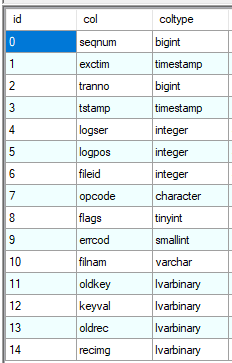
REPLLOGDT.FCS format
View the exception log with repadm
The replication administrator utility, repadm, can be used to view entries in REPLLOGDT.FCS with the getlog command.
Query the exception log with SQL
The replication exception log (REPLOGDT.FCS) is a FairCom file that contains a record for each error the Replication Agent has logged. This file can be imported into a SQL database for easier examination. With V11.6 and later no longer require exclusive access to a table for import and this can be done while REPLLOGDT.FCS is online.