Monitor
FairCom's Monitor UI can be used to view configurations, performance statistics, and monitor live data.
With the FairCom server running, open the browser-based menu (https://localhost:8443/) to access the FairCom graphical user interfaces.
Open DB Monitor to view configurations, capture and view performance snapshots, and monitor live connections, transactions, files, and so forth.
Overview
The following sections provide a visual overview of the various data tabs available in DB Monitor.
Note
The Monitor utility can be configured to show a variety of different graphs and metrics. To set options, edit the <faircom>/data/ctMonLayouts.json file.
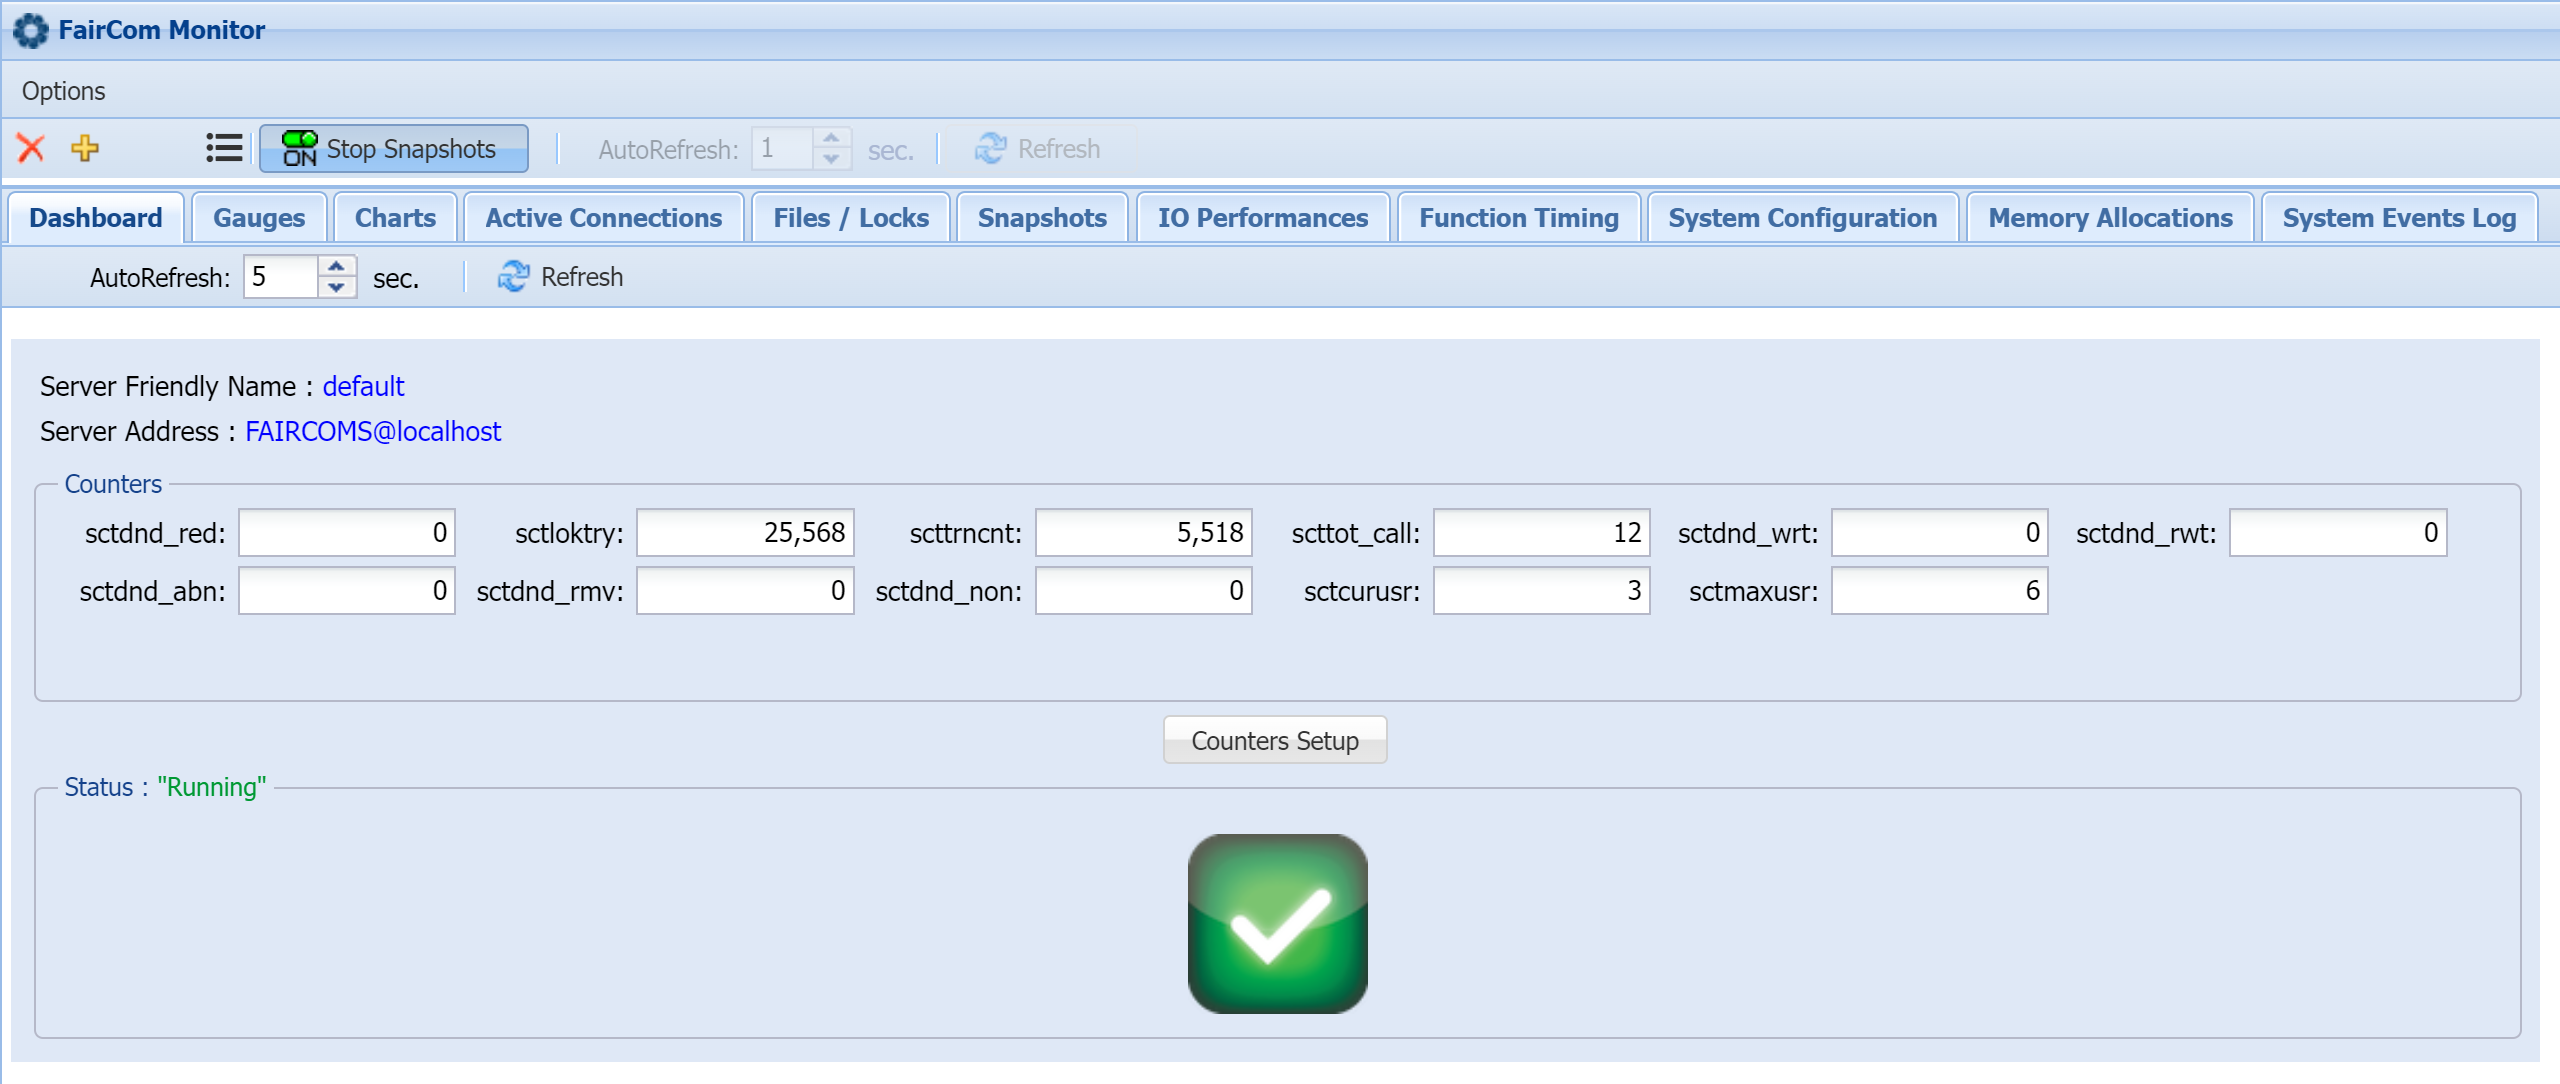
Dashboard
View server statistics counters and statuses.
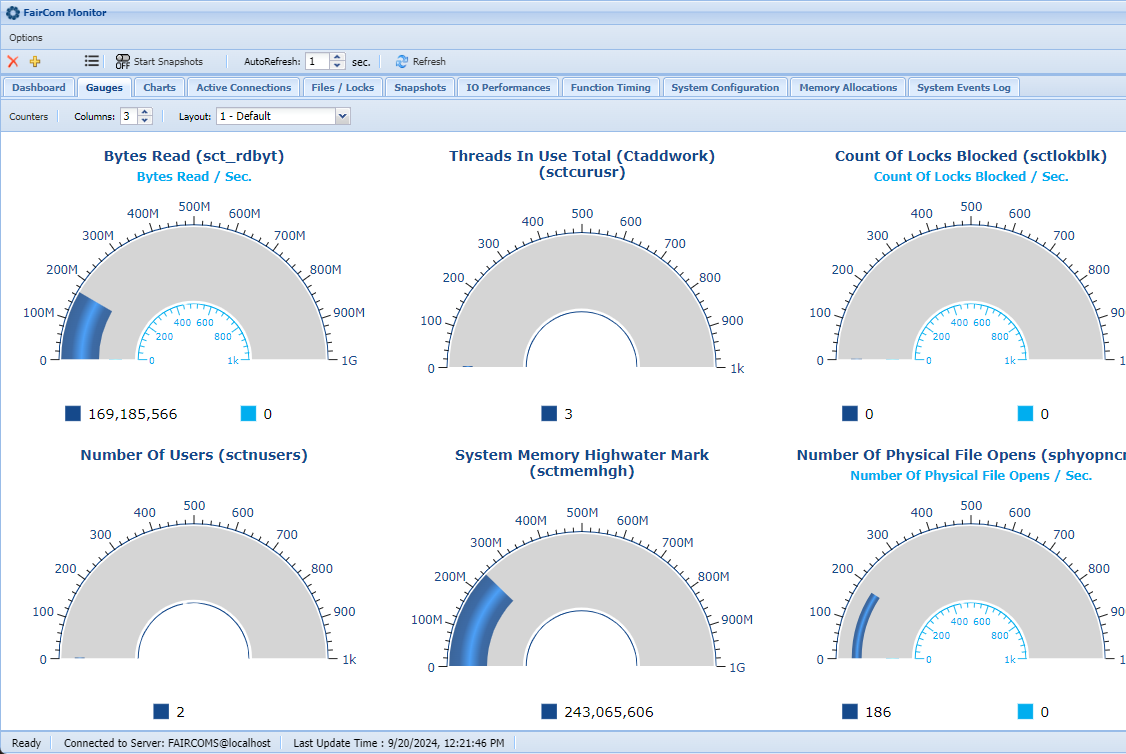
Gauges
Monitor selected metrics as gauges by selecting their corresponding counters.
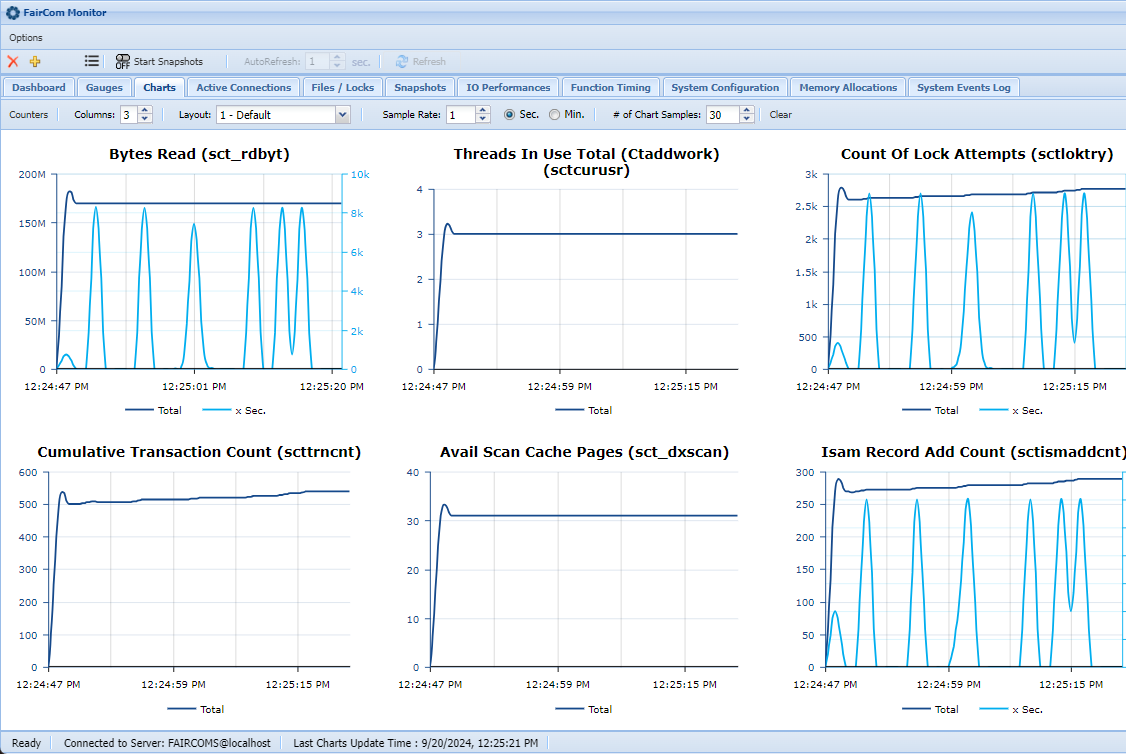
Charts
Monitor selected metrics as charts by selecting their corresponding counters.
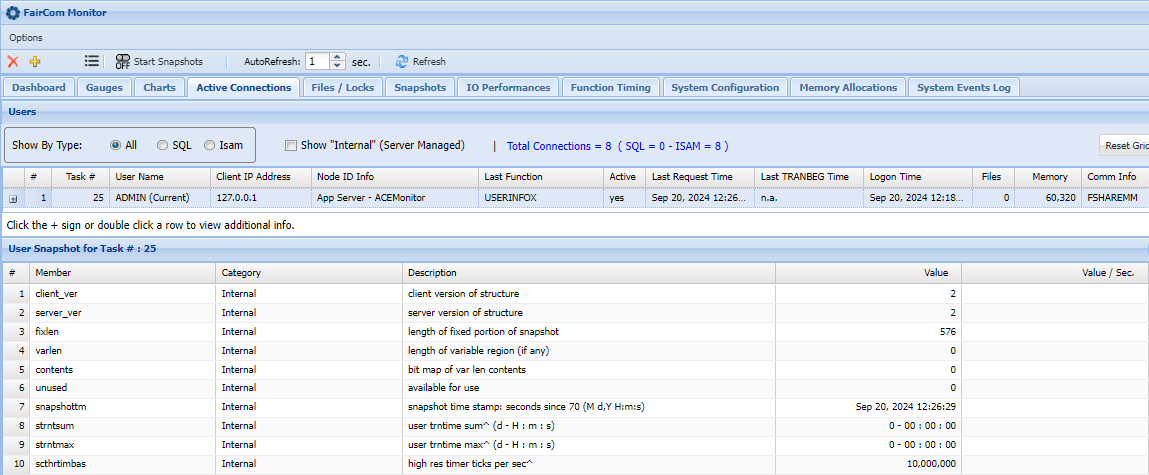
Active Connections
View currently active connections.
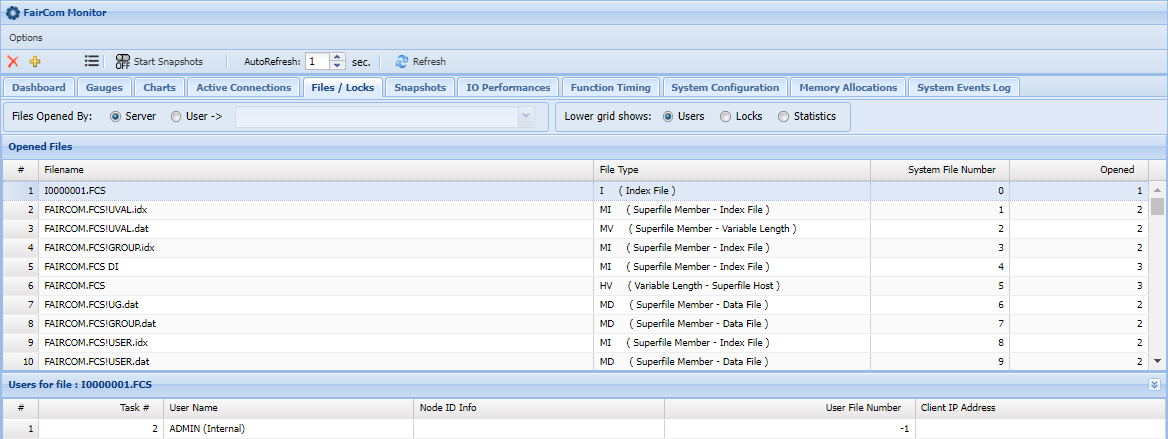
Files / Locks
Examine a comprehensive list of open files and active locks.
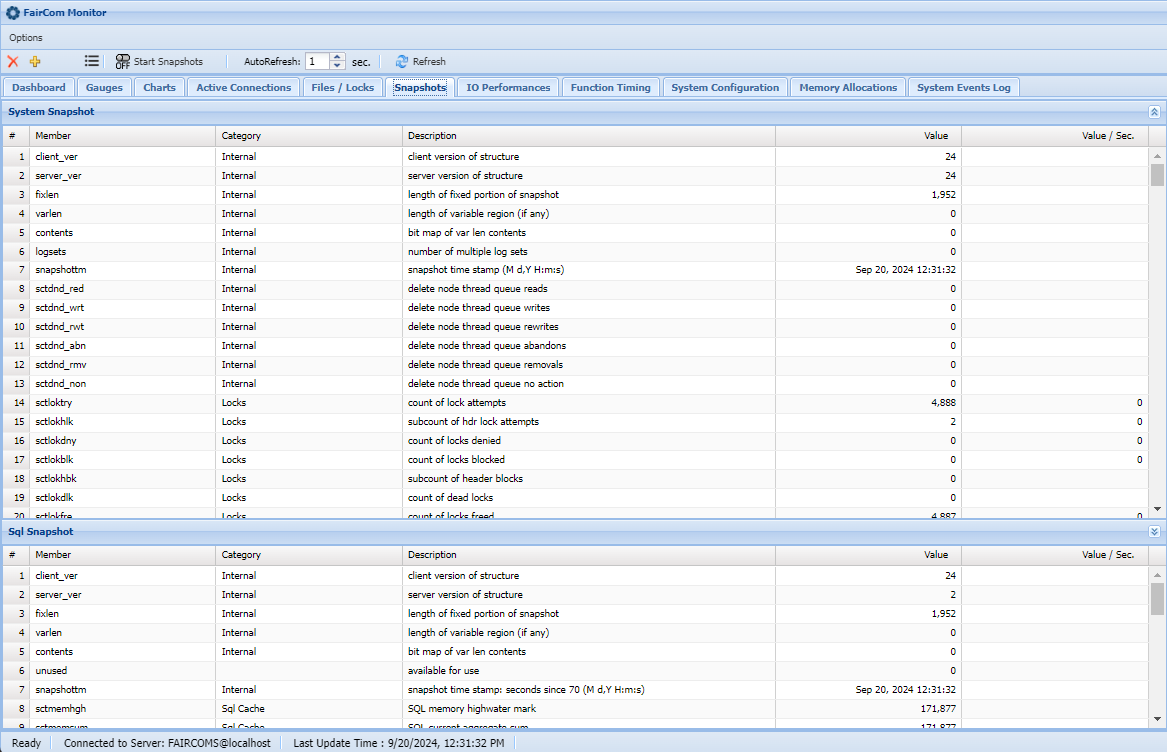
Snapshots
View both system and Sql snapshots and their descriptions
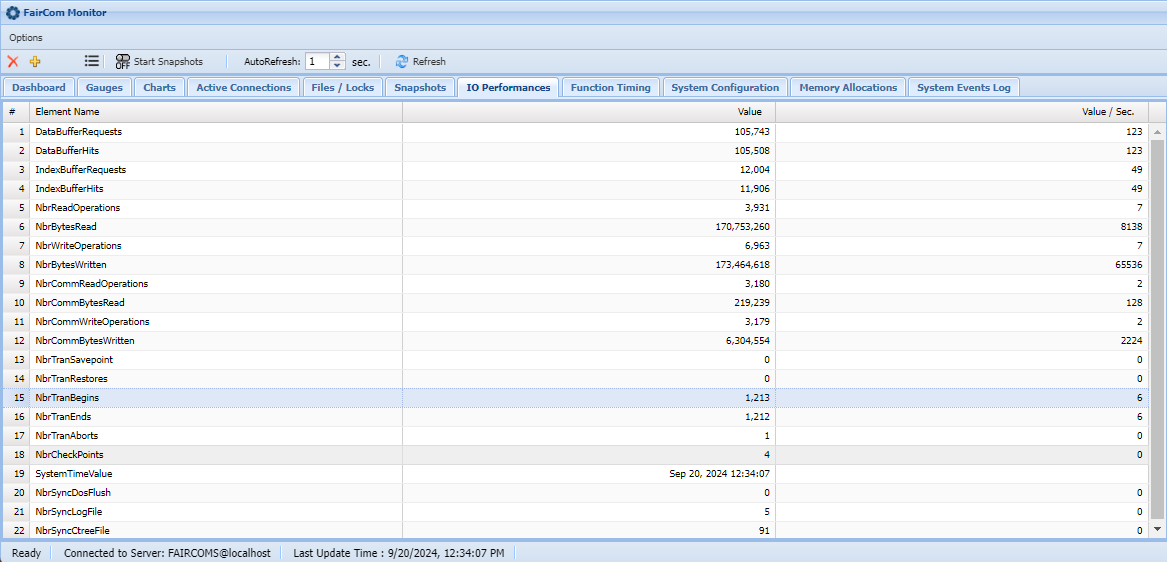
IO Performances
Function Timing

System Configuration
View the various configuration calls to the server.
