|
|
|
A trace of the server process can yield valuable information about performance bottlenecks. A good strategy is to use a utility to monitor the system call times while running a test utility, such as the cttctx test.
On Linux and some Unix platforms, the strace utility can be used to detail system calls. The -p flag will attach strace to a running process, which will be FairCom Server in this case. This allows you to monitor a specific instance of FairCom Server to analyze performance. Similar tools are available on other platforms such as Windows and Unix. Some Unix systems provide a similar utility named truss, although arguments may differ.
Note: The strace utility only attaches to the threads that existed when it was started.
You will need to know the process ID (PID) of the FairCom Server thread that will be monitored, as explained in the sections below. To find the PID, you may need to know the binary name of the FairCom Server:
To run strace on FairCom Server, use the following command:
strace -f -p PID -c
This command will run in the background until you press <CTRL>+C, and then it will output the system call counts and times.
Finding the FairCom Server Process ID
To use strace you will need to know the process ID (PID) of the FairCom Server thread you need to monitor. The sections below show several methods of determining the FairCom Server process ID.
Searching CTSTATUS.FCS
You can obtain the FairCom Server process ID by looking at the most recent start of FairCom Server within CTSTATUS.FCS. If you have more than one FairCom Server running on the machine, the best way to find the process ID is to look in CTSTATUS.FCS. You can search for "Process ID:" or simply "ID:" as shown below:
Fri May 8 08:08:00 2015
- User# 00001 Process ID: 18305
Viewing the Process Status (Unix/Linux)
The process status command, ps, shows information about the currently-running processes. That output can be searched, by piping it to grep, to find the FairCom Server process.
For the FairCom DB SQL Server use:
ps -ef | grep ctreesql | grep –v grep
For the FairCom DB ISAM Server use:
ps -ef | grep ctsrvr | grep –v grep
The following snippet shows an example of executing the ps command on a Unix/Linux system and searching the results for "ctree":
ps -ef | grep ctree
fctech 18305 13447 6 08:08 pts/4 00:00:00 ./ctreesql
fctech 18324 13447 0 08:08 pts/4 00:00:00 grep ctree
In this example, the second row containing "grep" is the grep command, which can be ignored. The first row is the ctreesql process.
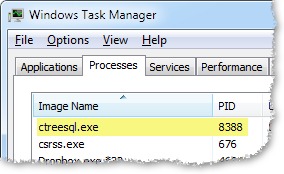
Using Task Manager (Windows)
On Windows, you can load Task Manager to find the FairCom DB process.
Monitoring System Call Times
The cttctx test can be used to monitor call times. To see the system call times for the thread that is running the test, follow these steps:
top -H -p CTREE_SERVER_PROCESS_ID
PID USER PR NI VIRT RES SHR S %CPU %MEM TIME+ COMMAND
7591 fctech 20 0 1095m 33m 3800 D 1.3 0.9 0:00.11 ctsrvr
7567 fctech 20 0 1095m 33m 3800 S 0.7 0.9 0:00.09 ctsrvr
7568 fctech 20 0 1095m 33m 3800 S 0.0 0.9 0:00.00 ctsrvr
7569 fctech 20 0 1095m 33m 3800 S 0.0 0.9 0:00.00 ctsrvr
strace -p 7591 -c
When the test finishes, stop strace and save the output. Collect the strace output for all cases of interest.
Using ctstat to Capture Statistics
The procedures below can be conducted to analyze performance when the system is running slow:
Note: These procedures will impact performance slightly, so we only recommend doing this on a limited basis.
ctstat -wrktime on -u ADMIN -p ADMIN -s FAIRCOMS
where "FAIRCOMS" should be replaced with the name of your FairCom Server.
ctstat -text -u ADMIN -p ADMIN -s FAIRCOMS -i 60
This command will not return to the command line. Allow it run for at least 10 minutes so you have several traces to analyze.
To stop execution, press CTRL+C to interrupt the program.
ctstat -wrktime off -u ADMIN -p ADMIN -s FAIRCOMS
The SNAPSHOT.FCS file can be analyzed to locate performance problems.
The Windows procdump Utility
The procdump utility on Windows can be set to trigger on a performance counter which might be handy if the response times are available in that form. The default procdump dump (without process memory) should be sufficient to see what is going on.
The procdump utility generates stack traces. For generating system call traces, use the Process Monitor utility. You can find more information by searching Microsoft Technet.

