Product Documentation

FairCom Java & .NET Stored Procedures

Previous Topic

Next Topic

Debugging Java Stored Procedures

FairCom DB SQL allows Java debugging tools, such as JSwat, to connect and directly debug stored procedure routines. JSwat is an open-source GUI Java debugger, which can be downloaded from https://github.com/nlfiedler/jswat.

This section includes information about configuring your environment to enable debugging with JSwat and provides an example of how to use JSwat.

In This Chapter

Enabling Java Debugging Tools

JSWAT Example

Previous Topic

Next Topic

Enabling Java Debugging Tools

FairCom DB SQL allows Java debugging tools to connect and directly debug stored procedure routines. To enable this feature, follow the following steps.

  1. Add the following keywords to ctsrvr.cfg:

    SETENV DEBUG_JVM=S

    SETENV DEBUG_JVM_PORT=45987

    The first keyword enables the FairCom DB SQL JVM debug feature by creating a TCP/IP socket at the port specified with the DEBUG_JVM_PORT keyword for a Java debugger to attach. In addition, the DEBUG_JVM keyword instruct the server to compile stored procedures with debugging information and to not remove the stored procedure source file from disk.

  2. Start the FairCom DB SQL server.
  3. Create a stored procedure (for example, “test”).
  4. Examine the database directory (i.e. ctreeSQL.dbs) for a .java file. This is the Java file source. Pay particular attention to the class name (i.e. public final class admin_test_SP extends JavaBaseSP).
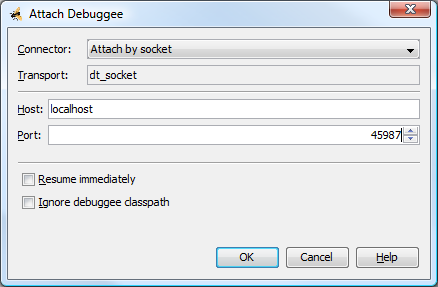
  5. Start a Java debugger and attach it to localhost on the port specified by DEBUG_JVM_PORT.

    For example, using the Java debugger included with the JDK, run:

    jdb -attach 45987

    (run on the same machine running the server to access the Java source files).

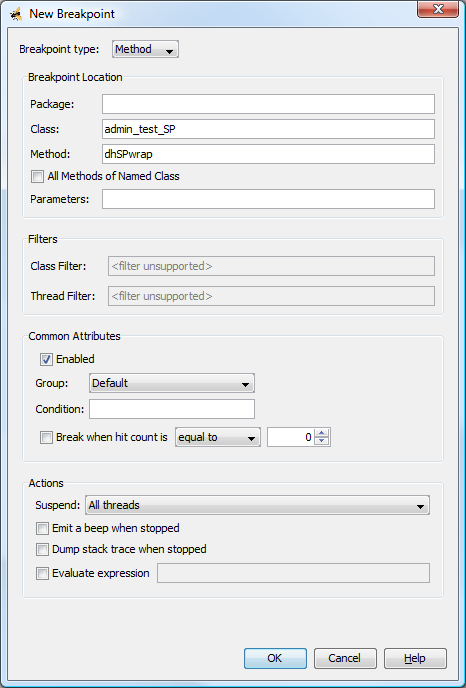
  6. Set a breakpoint on the method dhSPwrap of the stored procedure calls (i.e. admin_test_SP.dhSPwrap).
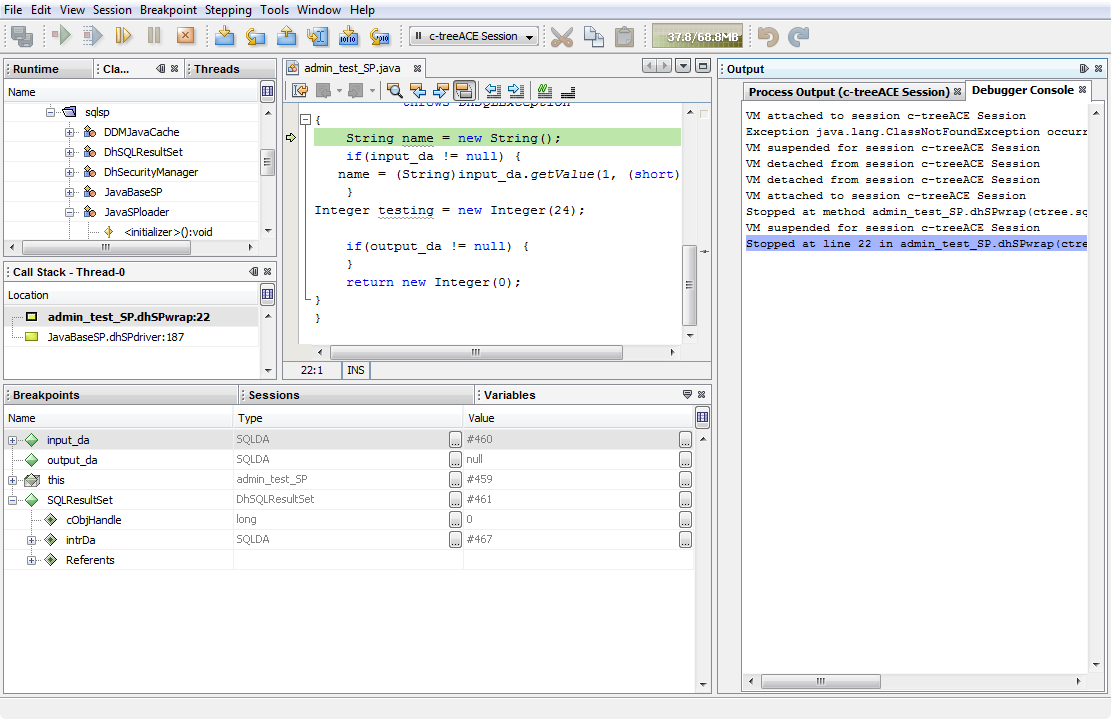
  7. Call the stored procedure from any client side SQL tool such as ISQL.
  8. The debugger should break at the start of the stored procedure.

Previous Topic

Next Topic

JSWAT Example

JSwat is an open-source GUI Java debugger. It can be downloaded from https://github.com/nlfiedler/jswat.

  1. Add the following keywords to ctsrvr.cfg:

    SETENV DEBUG_JVM=S

    SETENV DEBUG_JVM_PORT=45987

  2. Start the FairCom DB SQL Server.
  3. Start ISQL and create a stored procedure as follows:

    # isql -a ADMIN -u admin ctreeSQL

    CREATE PROCEDURE admin.test( IN name CHAR (20) )

    BEGIN

    Integer testing = new Integer(24);

    END

  4. Start jswat.
  5. Select “New Session” from the “Session” menu and edit the following information:
    1. Assign a name (for instance “FairCom DB Session”).
    2. Switch to the “classes” panel and add the path to the ctreeSQLSP.jar file and the path to the ctreeSQL.dbs directory.
    3. Switch to the “Sources” panel and add the path to the ctreeSQL.dbs directory.
  6. Select the session just created from the Sessions Drop Down menu on the toolbar.
  7. From the “Session” menu, click on “Attach”
  8. Configure the Transport as "Attach by socket". Fill in Host and Port with information from your FairCom DB SQL Server configuration.

    jswat_connect
    Click to Reduce

  9. Click OK (The “debugger console” should now read” “VM attached to session FairCom DB Session”.
  10. In the “Breakpoint” menu select “New Breakpoint” to create a new breakpoint.
    1. Set Breakpoint type to “Method.”
    2. Set Class to the stored procedure name (for example, admin_test_SP).
    3. Set Method to “dhSPwrap.”

    Click to Reduce

  11. Return to ISQL and run the stored procedure:

    call test ('John Smith');

  12. The debugger displays the current line in the stored procedure.

    Click to Reduce

TOCIndex