|
|
|
The main window features two tabs: Replication Management and Replication Logs, which displays logs of replication activity. You can monitor many details of operation in this tab. Filtering is provided to help you drill down to areas of interest.
|
|
|
If you choose to display a large number of entries (especially if you specify a very long Custom time period on a busy installation), the Replication Manager will display the log in multiple pages:
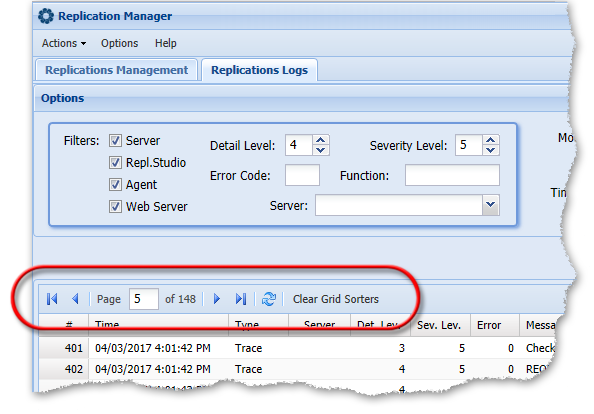
You can use the buttons shown in the above image to page through the log.
|
|
|
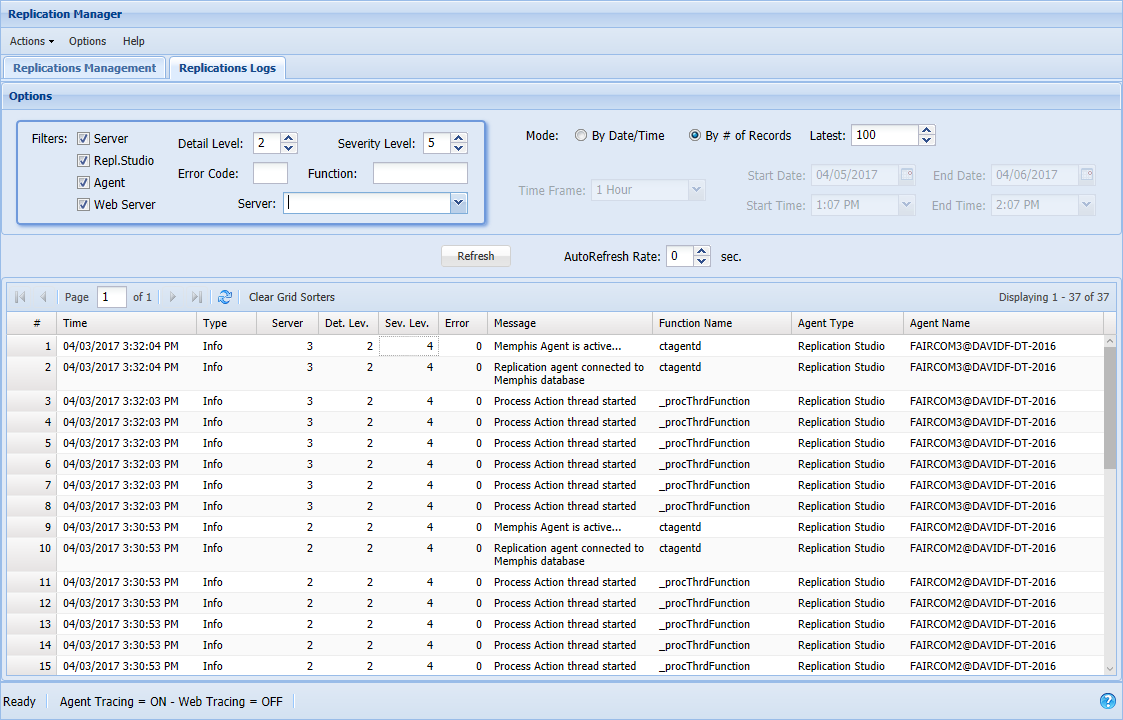
The Replication Logs tab displays logs of replication activity. You can monitor many details of operation in this tab. Filtering is provided to help you drill down to areas of interest.
Filtering the Logs
The Replication Manager allows you to filter the entries displayed in the log to make it easier to find what you are looking for. After setting the desired filters, click the Refresh button to display the filtered log.
Hint: Filtering affects the display only. It removes entries from the display, but it does not remove them from the log nor does it prevent them from being logged.
Server - Show entries logged by a c-tree server.
Repl. Studio - Show entries logged by the Replication Manager.
Agent - Show entries logged by Replication Agent.
Web Server - Show entries logged by the c-tree Web Server.
Detail Level - Select the level of detail to display (4 is the most detail, 1 the least):
1 - Only errors
2 - Basic (limited) information
3 - Trace basic level
4 - Trace detail level
Severity Level - The Severity Level indicates how critical an event is: 0 (most severe) through 5 (least severe). Select the level of severity to display. Items less severe than the level selected will not be shown.
0 - Most critical errors
1 - Critical errors
2 - Important errors
3 - Normal errors
4 - Informational messages
5 - Trace-level messages
Tip:
To see all info, select Detail Level 4 and Severity Level 5.
To see errors only, select Severity Level 3. To see less info about the errors, also select Detail Level 2.
Error Code - Filter to see only entries of the error code you enter.
Function - Filter to see only entries logged by the function you enter. You do not need to enter the entire function name: any function name beginning with the letters you type will be matched. Note: This function name is case-sensitive. A small X appears in the field to allow it to be cleared.
Server - Select a server to see only entries from that server (a small X by the server name allows you to stop filtering).
Display Options
Mode - You can display a portion of the log based on your mode: By Date/Time and By # of Records:
By Date/Time - When you display by date and time, you can specify a period of interest starting at a date and time and ending at a date and time. The Time Frame drop-down allows you to view entries logged in the most recent Hour, Day, Week, or Month. It also offers Custom, which allows you to specify a period of time by entering the Start Date, Start Time, End Date, and End Time.
By # of Records - If you set Mode to By # of Records, you can use Latest to specify how many log entries to display. By default, the window displays the latest 100 log entries. You can use this control to adjust the number of entries displayed.
Additional controls:
Refresh - Updates the log with the latest data. This button can be used if AutoRefresh is set to 0.
AutoRefresh Rate - This control allows you to set the number of seconds between each automatic refresh of the log data. A setting of 0 shuts off AutoRefresh (the data will be updated when you click Refresh).
Dump - The log is downloaded as a JSON file titled cfMemphis_Logs_YYYY_MM_DD_HHMMSS.json.
Columns
# - The line number/position in the log.
Time – The time the entry was logged.
Type – The nature of the event: Exception, Error, Info, Trace (detailed information).
Server – The server number (the Database ID of the server, as shown in the Publications window).
Det. Lev. – The detail level of the log entry. You can filter to see only entries of a certain level of detail (4=the greatest level of detail). Showing all details (4) displays the full text of the messages.
Sev. Lev. – The severity level of the log entry (0-5). You can filter to see only entries of a least a certain level of severity.
Error – The error number of the entry (0=OK).
Message – The text of the message.
Function Name – The name of the function that logged the message.
Agent Type – The type of agent that logged the message: the c-tree Web Server or the Replication Manager.
Agent Name – This is the name of the server the agent is on or "Web Server" if the message was logged by the c-tree Web Server.
|
|
|
The Plan Activity for plan... window is accessed by selecting Activity in the Existing Plans drop-down menu. This window allows you to monitor the activity of the selected replication plan.
Options
The Tabs:
Statistics Tab
The Statistics tab shows the replication activities related to the selected plan.
The following fields are provided:
Identification:
# – A number assigned to each log entry.
Type – The type of function that is being called: Direct (source to target) or Reverse (target to source).
Time – Shows the time stamp of the most recent transaction.
DB Connections:
Source (Connected to Source) – Shows if the connection to the Source Server (Master Server) is live.
Target (Connected to Target) – Shows if the connection to the Target Server (the local Replicated Server) is live.
Replication:
Paused – Indicates if replication has been paused.
Aborted – Indicates if replication has been aborted.
Failures – Indicates replication failures.
Latency – Settings for latency can be found in the Replication Latencies tab of the Replication Plan window. Shows how long ago the currently-replicated action happened.
Thread Counts:
Analyze – Number of threads used by the analyzer.
Apply – Number of apply threads.
Transactions Waiting:
Analyzer – Number of transactions waiting for the analyzer.
Eval – Number of transactions waiting for the dependency analyzer.
Resolution – Number of transactions waiting for the dependency resolution.
Apply – Number of transactions waiting to be applied.
Transaction Throughput:
Commits – Number of commits.
Add – Number of adds.
Update – Number of updates.
Delete – Number of deletes.
Exceptions Tab
The Exceptions tab shows error and informational messages written by the Replication Agent.
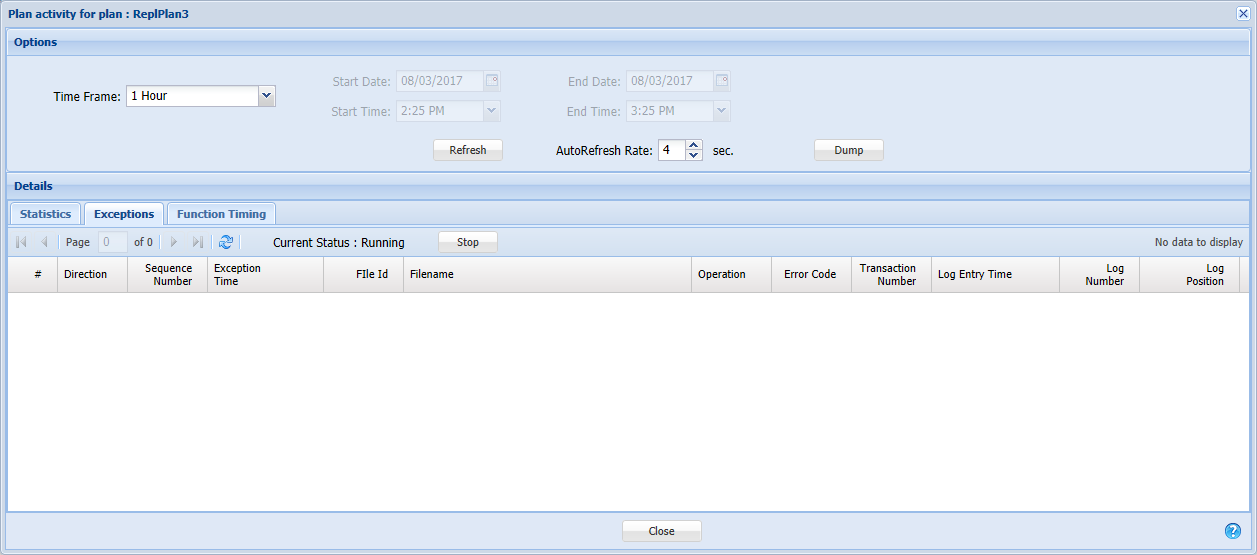
# – A number assigned to each log entry.
Direction – Direct (source to target) or Reverse (target to source).
Sequence Number – The number of times the function has been called. This is a number the Replication Agent increments for every function call it makes to the source and target servers. It is provided as an easy way to confirm activity is occurring within the system.
Exception Time – The time the exception occurred.
File ID – The unique identifier of the file involved.
Filename – The name of the file involved.
Operation – The operation that was being performed when the exception occurred.
Error Code – The error that was generated.
Transaction Number – The number assigned to the transaction.
Log Entry Time – The time the entry was logged.
Log Number – The number assigned to the log entry.
Log Position – The position of the entry in the Transaction Log that is being replicated.
Function Timing Tab
The Function Timing tab displays the time spent on each operation.
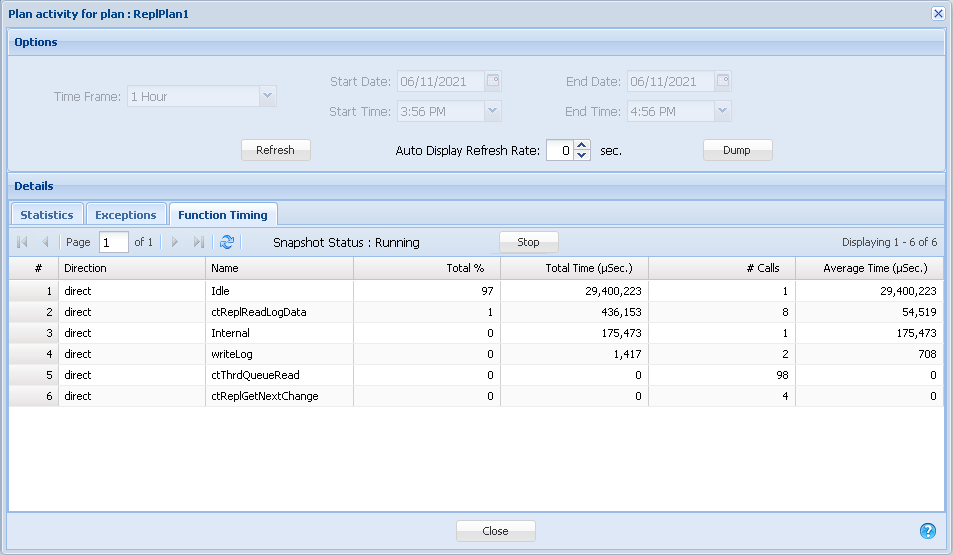
# – A number assigned to each log entry.
Direction – Direct (source to target) or Reverse (target to source).
Name – The name of the function.
Total % – Function time as a percentage of the total time replication has been running.
Total Time (mSec. - microseconds) – The number of microseconds spent on this function.
# Calls – The number of times the function has been called.
Average Time (mSec. - microseconds) – The average number of microseconds spent performing this function.

